This is my short saga about my not necessarily intelligent actions for reading a DocBook paper.
So I wanted to read some documentation from my Linux kernel sources. It happened to be in DocBook format.
In the kernel source’s root, I tried
$ make htmldocs
or I could have gone
$ make pdfdocs
Or mandocs. Or sgmldocs. Or psdocs.
But that builds only the DocBook templates in Documentation/DocBook/. I need those in Documentation/sound/alsa/DocBook!
I tried to copy the Makefile to the target directory, and change the assignment of DOCBOOKS to the files I wanted handled. But that didn’t work, because the Makefile couldn’t find the script/ subdirectory. Or as “make” put it:
make: *** No rule to make target `/scripts/kernel-doc', needed by `/alsa-driver-api.tmpl'. Stop.
OK, this was a bit too much. How about just going…
$ docbook2html writing-an-alsa-driver.tmpl
Works, creates a lot of scattered HTML files. Not so easy to read. Can’t I get it in a single document?
$ docbook2rtf writing-an-alsa-driver.tmpl
Huh? WTF? RTF? Yes, it’s apparently still alive. And hey, one can easily export it to PDF with OpenOffice!
This probably isn’t exactly the way the kernel hackers meant it to be done. On the other hand, it’s by far too much effort for just reading a document by and for the community…
I’m sure someone knowns about the obvious way I missed. Comments below, please…
What this blob is all about
Running some home-cooked SDMA scripts on Freescale’s Linux 2.6.28 kernel on an i.MX25 processor, I’m puzzled by the fact, that cache flushing with dma_map_single(…, DMA_TO_DEVICE) doesn’t hurt, but nothing happens if the calls are removed. On the other hand, attempting to remove cache invalidation calls, as in dma_map_single(…, DMA_FROM_DEVICE) does cause data corruption, as one would expect.
The de-facto lack of need for cache flushing could be explained by the small size of the cache: The sequence of events is typically preparing the data in the buffer, then some stuff in the middle, and only then is the SDMA script kicked off. If the cache lines are evicted naturally as a result of that “some stuff” activity, one gets away with not flushing the cache explicitly.
I’m by no means saying that cache flushing shouldn’t be done. On the contrary, I’m surprised that things don’t break when it’s removed.
So why doesn’t one get away with not invalidating the cache? In my tests, I saw 32-byte segments going wrong when I dropped the invalidation. That is, some segments, typically after a handful of successful data transactions of less than 1 kB of data.
Why does dropping the invalidation break things, and dropping the flushing doesn’t? As I said above, I’m still puzzled by this.
So I went down to the details of what these calls to dma_map_single() do. Spoiler: I didn’t find an explanation. At the end of the foodchain, there are several MCR assembly instructions, as one should expect. Both flushing and invalidation apparently does something useful.
The rest of this post is the dissection of Linux’ kernel code in this respect.
The gory details
DMA mappings and sync functions practically wrap the dma_cache_maint() function, e.g. in arch/arm/include/asm/dma-mapping.h:
static inline dma_addr_t dma_map_single(struct device *dev, void *cpu_addr,
		size_t size, enum dma_data_direction dir)
{
	BUG_ON(!valid_dma_direction(dir));

	if (!arch_is_coherent())
		dma_cache_maint(cpu_addr, size, dir);

	return virt_to_dma(dev, cpu_addr);
}
It was verified with disassembly that dma_map_single() was implemented with a call to dma_cache_maint().
This function can be found in arch/arm/mm/dma-mapping.c as follows
/*
 * Make an area consistent for devices.
 * Note: Drivers should NOT use this function directly, as it will break
 * platforms with CONFIG_DMABOUNCE.
 * Use the driver DMA support - see dma-mapping.h (dma_sync_*)
 */
void dma_cache_maint(const void *start, size_t size, int direction)
{
	const void *end = start + size;

	BUG_ON(!virt_addr_valid(start) || !virt_addr_valid(end - 1));

	switch (direction) {
	case DMA_FROM_DEVICE:		/* invalidate only */
		dmac_inv_range(start, end);
		outer_inv_range(__pa(start), __pa(end));
		break;
	case DMA_TO_DEVICE:		/* writeback only */
		dmac_clean_range(start, end);
		outer_clean_range(__pa(start), __pa(end));
		break;
	case DMA_BIDIRECTIONAL:		/* writeback and invalidate */
		dmac_flush_range(start, end);
		outer_flush_range(__pa(start), __pa(end));
		break;
	default:
		BUG();
	}
}
EXPORT_SYMBOL(dma_cache_maint);
The outer_* calls are defined as null functions in arch/arm/include/asm/cacheflush.h, since the CONFIG_OUTER_CACHE kernel configuration flag isn’t set.
The dmac_* macros are defined in arch/arm/include/asm/cacheflush.h as follows:
#define dmac_inv_range			__glue(_CACHE,_dma_inv_range)
#define dmac_clean_range		__glue(_CACHE,_dma_clean_range)
#define dmac_flush_range		__glue(_CACHE,_dma_flush_range)
where __glue() simply glues the two strings together (see arch/arm/include/asm/glue.h) and _CACHE equals “arm926″ for the i.MX25, so e.g. dmac_clean_range becomes arm926_dma_clean_range.
These actual functions are implemented in assembler in arch/arm/mm/proc-arm926.S:
/*
 *	dma_inv_range(start, end)
 *
 *	Invalidate (discard) the specified virtual address range.
 *	May not write back any entries.  If 'start' or 'end'
 *	are not cache line aligned, those lines must be written
 *	back.
 *
 *	- start	- virtual start address
 *	- end	- virtual end address
 *
 * (same as v4wb)
 */
ENTRY(arm926_dma_inv_range)
#ifndef CONFIG_CPU_DCACHE_WRITETHROUGH
	tst	r0, #CACHE_DLINESIZE - 1
	mcrne	p15, 0, r0, c7, c10, 1		@ clean D entry
	tst	r1, #CACHE_DLINESIZE - 1
	mcrne	p15, 0, r1, c7, c10, 1		@ clean D entry
#endif
	bic	r0, r0, #CACHE_DLINESIZE - 1
1:	mcr	p15, 0, r0, c7, c6, 1		@ invalidate D entry
	add	r0, r0, #CACHE_DLINESIZE
	cmp	r0, r1
	blo	1b
	mcr	p15, 0, r0, c7, c10, 4		@ drain WB
	mov	pc, lr

/*
 *	dma_clean_range(start, end)
 *
 *	Clean the specified virtual address range.
 *
 *	- start	- virtual start address
 *	- end	- virtual end address
 *
 * (same as v4wb)
 */
ENTRY(arm926_dma_clean_range)
#ifndef CONFIG_CPU_DCACHE_WRITETHROUGH
	bic	r0, r0, #CACHE_DLINESIZE - 1
1:	mcr	p15, 0, r0, c7, c10, 1		@ clean D entry
	add	r0, r0, #CACHE_DLINESIZE
	cmp	r0, r1
	blo	1b
#endif
	mcr	p15, 0, r0, c7, c10, 4		@ drain WB
	mov	pc, lr

/*
 *	dma_flush_range(start, end)
 *
 *	Clean and invalidate the specified virtual address range.
 *
 *	- start	- virtual start address
 *	- end	- virtual end address
 */
ENTRY(arm926_dma_flush_range)
	bic	r0, r0, #CACHE_DLINESIZE - 1
1:
#ifndef CONFIG_CPU_DCACHE_WRITETHROUGH
	mcr	p15, 0, r0, c7, c14, 1		@ clean+invalidate D entry
#else
	mcr	p15, 0, r0, c7, c6, 1		@ invalidate D entry
#endif
	add	r0, r0, #CACHE_DLINESIZE
	cmp	r0, r1
	blo	1b
	mcr	p15, 0, r0, c7, c10, 4		@ drain WB
	mov	pc, lr
The CONFIG_CPU_DCACHE_WRITETHROUGH kernel configuration flag is not set, so there are no shortcuts.
Exactly the same snippet, only disassembled from the object file (using objdump -d):
000004d4 <arm926_dma_inv_range>:
 4d4:	e310001f 	tst	r0, #31
 4d8:	1e070f3a 	mcrne	15, 0, r0, cr7, cr10, {1}
 4dc:	e311001f 	tst	r1, #31
 4e0:	1e071f3a 	mcrne	15, 0, r1, cr7, cr10, {1}
 4e4:	e3c0001f 	bic	r0, r0, #31
 4e8:	ee070f36 	mcr	15, 0, r0, cr7, cr6, {1}
 4ec:	e2800020 	add	r0, r0, #32
 4f0:	e1500001 	cmp	r0, r1
 4f4:	3afffffb 	bcc	4e8 <arm926_dma_inv_range+0x14>
 4f8:	ee070f9a 	mcr	15, 0, r0, cr7, cr10, {4}
 4fc:	e1a0f00e 	mov	pc, lr

00000500 <arm926_dma_clean_range>:
 500:	e3c0001f 	bic	r0, r0, #31
 504:	ee070f3a 	mcr	15, 0, r0, cr7, cr10, {1}
 508:	e2800020 	add	r0, r0, #32
 50c:	e1500001 	cmp	r0, r1
 510:	3afffffb 	bcc	504 <arm926_dma_clean_range+0x4>
 514:	ee070f9a 	mcr	15, 0, r0, cr7, cr10, {4}
 518:	e1a0f00e 	mov	pc, lr

0000051c <arm926_dma_flush_range>:
 51c:	e3c0001f 	bic	r0, r0, #31
 520:	ee070f3e 	mcr	15, 0, r0, cr7, cr14, {1}
 524:	e2800020 	add	r0, r0, #32
 528:	e1500001 	cmp	r0, r1
 52c:	3afffffb 	bcc	520 <arm926_dma_flush_range+0x4>
 530:	ee070f9a 	mcr	15, 0, r0, cr7, cr10, {4}
 534:	e1a0f00e 	mov	pc, lr
So there’s actually little to learn from the disassembly. Or at all…
This is a simple and quick solution for those of us who want to run certain programs as a different user on the same desktop, for example running several user profiles of a browser at the same time. The main problem is usually that Pulseaudio doesn’t accept connections from a user other than the one logged in on the desktop.
It’s often suggested to go for a system mode Pulseaudio daemon, but judging from the developer’s own comments on this, and the friendly messages left in the system’s log when doing this, like
Jan 18 16:35:33 ocho pulseaudio[11158]: main.c: OK, so you are running PA in system mode. Please note that you most likely shouldn't be doing that.
Jan 18 16:35:33 ocho pulseaudio[11158]: main.c: If you do it nonetheless then it's your own fault if things don't work as expected.
Jan 18 16:35:33 ocho pulseaudio[11158]: main.c: Please read http://pulseaudio.org/wiki/WhatIsWrongWithSystemMode for an explanation why system mode is usually a bad idea.
Jan 18 16:35:33 ocho pulseaudio[11158]: module.c: module-hal-detect is deprecated: Please use module-udev-detect instead of module-hal-detect!
Jan 18 16:35:33 ocho pulseaudio[11158]: module-hal-detect-compat.c: We will now load module-udev-detect. Please make sure to remove module-hal-detect from your configuration
it’s probably not such a good idea. Plus that in my case, the sound card wasn’t detected in system wide mode, probably because some configuration issue, which I didn’t care much about working on. The bottom line is that the software’s authors don’t really want this to work.
Opening a TCP socket instead
The simple solution is given on this forum thread. This works well when there’s a specific user always logged on, and programs belonging to other dummy users are always run for specific purposes.
The idea behind this trick is to open a TCP port for native Pulseaudio communication, only it doesn’t require authentication, as long as the connection comes from 127.0.0.1, i.e. from the host itself. This opens the audio interface to any program running on the computer, including recording from the microphone. This makes no significant difference security-wise if the computer is accessed by a single user anyhow (possible spyware is likely to run with the logged in user ID anyhow, which has full access to audio either way).
This solution works on Fedora Core 12, but it’s probably the way to do it on any distribution released since 2009 or so.
Edit: It has been suggested in the comments below to use a UNIX socket instead of TCP. Haven’t tried it, but it seems like a better solution.
To do as the desktop’s user
So let’s get to the hands-on: First, copy /etc/pulse/default.pa into a file with the same name in the .pulse directory, that is
cp /etc/pulse/default.pa ~/.pulse/
And then edit the file, adding the following line at the end:
load-module module-native-protocol-tcp auth-ip-acl=127.0.0.1
At this point, restart the pulseaudio deamon,
$ pulseaudio -k
$ pulseaudio -D
To do as the “fake” user
Now switch to the second user, and create a file named client.conf under that user’s .pulse subdirectory
$ echo "default-server = 127.0.0.1" > ~/.pulse/client.conf
Note that default.pa and client.conf are in completely different directories, each belonging to a different user!
Surprisingly enough, that’s it. Any program running as the second user now has sound access.
The problem
In short: Running linux 3.8.0 on Altera’s Cyclone V SoC, NetworkManager doesn’t bring up the Ethernet port. It also makes false accusations such as
Jan 1 00:00:17 localhost NetworkManager[1206]: <info> (eth0): driver 'stmmaceth' does not support carrier detection.
and later on also says
Jan  1 00:00:17 localhost NetworkManager[1206]: <warn> (eth0): couldn't get carrier state: (-1) unknown
Jan  1 00:00:17 localhost NetworkManager[1206]: <info> (eth0): carrier now OFF (device state 20, deferring action for 4 seconds)
And asking more directly,
# nm-tool eth0
NetworkManager Tool

State: disconnected

- Device: eth0 -----------------------------------------------------------------
  Type:              Wired
  Driver:            stmmaceth
  State:             unavailable
  Default:           no
  HW Address:        96:A7:6F:4E:DD:6D

  Capabilities:

  Wired Properties
    Carrier:         off
All of this is, of course, incorrect. Even though it’s not clear who to blame for this. But the driver detects the carrier all right:
# cat /sys/class/net/eth0/carrier
1
and as we shall see below, the ioctl() interface is also supported. Only it doesn’t work as NetworkManager expects it to.
Well, I bluffed a bit proving that the carrier detection works. Explained later.
So what went wrong?
Nothing like digging in the source code. In NetworkManager’s nm-device-ethernet.c, the function supports_ethtool_carrier_detect() goes
static gboolean
supports_ethtool_carrier_detect (NMDeviceEthernet *self)
{
	int fd;
	struct ifreq ifr;
	gboolean supports_ethtool = FALSE;
	struct ethtool_cmd edata;

	g_return_val_if_fail (self != NULL, FALSE);

	fd = socket (PF_INET, SOCK_DGRAM, 0);
	if (fd < 0) {
		nm_log_err (LOGD_HW, "couldn't open control socket.");
		return FALSE;
	}

	memset (&ifr, 0, sizeof (struct ifreq));
	strncpy (ifr.ifr_name, nm_device_get_iface (NM_DEVICE (self)), IFNAMSIZ);

	edata.cmd = ETHTOOL_GLINK;
	ifr.ifr_data = (char *) &edata;

	errno = 0;
	if (ioctl (fd, SIOCETHTOOL, &ifr) < 0) {
		nm_log_dbg (LOGD_HW | LOGD_ETHER, "SIOCETHTOOL failed: %d", errno);
		goto out;
	}

	supports_ethtool = TRUE;

out:
	close (fd);
	nm_log_dbg (LOGD_HW | LOGD_ETHER, "ethtool %s supported",
	            supports_ethtool ? "is" : "not");
	return supports_ethtool;
}
Obviously, this is the function that determines if the port supplies carrier detection. There is also a similar function for MII, supports_mii_carrier_detect (). A simple strace reveals what went wrong:
And indeed, in the strace log with this driver it says
socket(PF_INET, SOCK_DGRAM, IPPROTO_IP) = 17
ioctl(17, SIOCETHTOOL, 0x7e93bcdc)      = -1 EBUSY (Device or resource busy)
close(17)                               = 0
socket(PF_INET, SOCK_DGRAM, IPPROTO_IP) = 17
ioctl(17, SIOCGMIIPHY, 0x7e93bcfc)      = -1 EINVAL (Invalid argument)
close(17)                               = 0
open("/proc/sys/net/ipv6/conf/eth0/accept_ra", O_RDONLY|O_LARGEFILE) = -1 ENOENT (No such file or directory)
open("/proc/sys/net/ipv6/conf/eth0/use_tempaddr", O_RDONLY|O_LARGEFILE) = -1 ENOENT (No such file or directory)
gettimeofday({4101, 753554}, NULL)      = 0
send(6, "<30>Jan  1 01:08:21 NetworkManager[1701]: <info> (eth0): driver 'stmmaceth' does not support carrier detection.", 111, MSG_NOSIGNAL) = 111
so we can see that the attempt made in supports_ethtool_carrier_detect() failed with an EBUSY, and the one made by supports_mii_carrier_detect () failed as well, with an EINVAL. In other words, the ethtool (which is loosely related to the ethtool utility) ioctl() interface was recognized, but the driver said the driver was busy (a silly return code, as we shall see later), and the MII ioctl() interface was rejected altogether.
Since NetworkManager doesn’t support carrier detection based on Sysfs, the final conclusion is that there is no carrier detection.
But why did the driver answer EBUSY in the first place?
Some kernel digging
The relevant Linux kernel is 3.8.0.
ioctl() calls to network devices are handled by the dev_ioctl() function in net/core/dev.c (not in drivers/, and it was later on moved to dev_ioctl.c) as follows:
	case SIOCETHTOOL:
		dev_load(net, ifr.ifr_name);
		rtnl_lock();
		ret = dev_ethtool(net, &ifr);
		rtnl_unlock();
		if (!ret) {
			if (colon)
				*colon = ':';
			if (copy_to_user(arg, &ifr,
					 sizeof(struct ifreq)))
				ret = -EFAULT;
		}
		return ret;
Note that the ioctl() call is based upon the name of the interface as a string (e.g. “eth0″). The call to dev_load hence loads a kernel module if the respective driver isn’t loaded yet. The dev_ethtool() function is in net/core/ethtool.c. This function first runs a few sanity checks + permissions, and may return ENODEV, EFAULT or EPERM, depending on different mishaps.
Most notably, it runs
	if (dev->ethtool_ops->begin) {
		rc = dev->ethtool_ops->begin(dev);
		if (rc  < 0)
			return rc;
	}
which in the case of stmmac is
static int stmmac_check_if_running(struct net_device *dev)
{
	if (!netif_running(dev))
		return -EBUSY;
	return 0;
}
netif_running(dev) is defined in include/linux/netdevice.h as follows:
static inline bool netif_running(const struct net_device *dev)
{
	return test_bit(__LINK_STATE_START, &dev->state);
}
This function returns true when the device is “up”, exactly in the sense of “ifconfig up”.
Say what?
NetworkManager made the SIOCETHTOOL ioctl() call before bringing up the eth0 interface in order to check if it supports carrier detect. But since it wasn’t up (why should it be? NetworkManager didn’t bring it up), the driver’s sanity check (?) failed the ioctl() call with an EBUSY, as netif_running() returns false — the interface was down. So NetworkManager marked the interface as not supporting carrier detect, and took it up even so. This made the driver say that it has detected a carrier, but since NetworkManager didn’t expect that to happen, it started fooling around, and eventually didn’t bring up the interface properly (no DHCP, in particular).
As it turns out, netif_running(dev) returns zero, which is the reason the whole thing fails with an EBUSY.
Now let’s return to the Sysfs detection of the carrier. With the eth0 interface down, it goes like this
# cat /sys/class/net/eth0/carrier
cat: /sys/class/net/eth0/carrier: Invalid argument
# ifconfig eth0 up
# cat /sys/class/net/eth0/carrier
0
# cat /sys/class/net/eth0/carrier
1
The two successive carrier detections give different results, because it takes a second or so before the carrier is detected. There was nothing changed with the hardware inbetween (no cable was plugged in or something).
So NetworkManager was partly right: There driver doesn’t support carrier detection as long as the interface isn’t brought up.
Solution
The solution is surprisingly simple. Just make sure
ifconfig eth0 up
is executed before NetworkManager is launched. That’s it. Suddenly nm-tool sees a completely different interface:
# nm-tool eth0

NetworkManager Tool

State: connected (global)

- Device: eth0  [Wired connection 1] -------------------------------------------
  Type:              Wired
  Driver:            stmmaceth
  State:             connected
  Default:           yes
  HW Address:        9E:37:A8:56:CF:EC

  Capabilities:
    Carrier Detect:  yes
    Speed:           100 Mb/s

  Wired Properties
    Carrier:         on

  IPv4 Settings:
    Address:         10.1.1.242
    Prefix:          24 (255.255.255.0)
    Gateway:         10.1.1.3

    DNS:             10.2.0.1
    DNS:             10.2.0.2
Who should we blame here? Probably NetworkManager. Since it’s bringing up the interface anyhow, why not ask it if it supports carrier detection after the interface is up? I suppose that the driver has its reasons for not cooperating while it’s down.
Epilogue
Since I started with dissecting the kernel’s code, here’s what happens with the call to dev_ethtool() mentioned above, when it passes the “sanity check”. There’s a huge case statement, with the relevant part saying
	case ETHTOOL_GLINK:
		rc = ethtool_get_link(dev, useraddr);
		break;
the rc value is propagated up when this call finishes (after some possible other operations, which are probably not relevant).
And then we have, in the same file,
static int ethtool_get_link(struct net_device *dev, char __user *useraddr)
{
	struct ethtool_value edata = { .cmd = ETHTOOL_GLINK };

	if (!dev->ethtool_ops->get_link)
		return -EOPNOTSUPP;

	edata.data = netif_running(dev) && dev->ethtool_ops->get_link(dev);

	if (copy_to_user(useraddr, &edata, sizeof(edata)))
		return -EFAULT;
	return 0;
}
The ethtool_value structure is defined in include/uapi/linux/ethtool.h saying
struct ethtool_value {
	__u32	cmd;
	__u32	data;
};
Note that if netif_running(dev) returns false, zero is returned on the edata entry of the answer, but the call is successful (it actually makes sense). But this never happens with the current driver, as was seen above.
It’s fairly safe to assume that drivers/net/ethernet/stmicro/stmmac/stmmac_ethtool.c handles the actual call, as it has
static const struct ethtool_ops stmmac_ethtool_ops = {
	.begin = stmmac_check_if_running,
... snip ...
	.get_link = ethtool_op_get_link,
... snip ...
};
but ethtool_op_get_link() is defined in net/core/ethtool.c (we’re running in circles…) saying simply
u32 ethtool_op_get_link(struct net_device *dev)
{
	return netif_carrier_ok(dev) ? 1 : 0;
}
which bring us to include/linux/netdevice.h where it says
static inline bool netif_carrier_ok(const struct net_device *dev)
{
	return !test_bit(__LINK_STATE_NOCARRIER, &dev->state);
}
This rises the question why the driver refuses to answer ETHTOOL_GLINK requests when it’s down. It’s not even involved in answering this request. But having attempted to modify the driver, so ETHTOOL_GLINK is let through even when the interface is down, I can say that it still confused NetworkManager. I didn’t get down to why exactly.
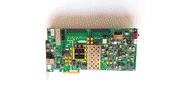
At times, it’s useful to have a high-resolution picture of the board in front of you. For example, finding the correct place to touch with a probe is easier when the point is first found on the computer screen.
These are two very detailed images of the Sockit board by Terasic and Arrow Electronics (and Altera), featuring a Cyclone V SoC FPGA.
The images below are small, and are just links to the bigger files. The USB plug that is connected is the OTG port (for connecting a keyboard or USB stick etc.)


And finally, here’s a short video clip showing what it looks like when powering on the board with Xillinux:
Suppose that we have a file, batch-commands.sh, which consists of independent commands to be executed, one for each line. Now we want to run several of these in parallel.
xargs -P 8 -n 1 -d "\n" -a batch-commands.sh bash -c
With -P 8 there are 8 processes running all the time.
The short answer is $quartus(version). Those familiar with Tcl immediately tell that there’s a named array (hash), $quartus, containing a key “version” which returns the full revision name.
So, entering an interactive session,
$ quartus_sh -s
Info: *******************************************************************
Info: Running Quartus II 32-bit Shell
 Info: Version 13.0.1 Build 232 06/12/2013 Service Pack 1 SJ Web Edition
 Info: Copyright (C) 1991-2013 Altera Corporation. All rights reserved.
 Info: Your use of Altera Corporation's design tools, logic functions
 Info: and other software and tools, and its AMPP partner logic
 Info: functions, and any output files from any of the foregoing
 Info: (including device programming or simulation files), and any
 Info: associated documentation or information are expressly subject
 Info: to the terms and conditions of the Altera Program License
 Info: Subscription Agreement, Altera MegaCore Function License
 Info: Agreement, or other applicable license agreement, including,
 Info: without limitation, that your use is for the sole purpose of
 Info: programming logic devices manufactured by Altera and sold by
 Info: Altera or its authorized distributors.  Please refer to the
 Info: applicable agreement for further details.
 Info: Processing started: Mon Dec 23 16:08:47 2013
Info: *******************************************************************
Info: The Quartus II Shell supports all TCL commands in addition
Info: to Quartus II Tcl commands. All unrecognized commands are
Info: assumed to be external and are run using Tcl's "exec"
Info: command.
Info: - Type "exit" to exit.
Info: - Type "help" to view a list of Quartus II Tcl packages.
Info: - Type "help <package name>" to view a list of Tcl commands
Info:   available for the specified Quartus II Tcl package.
Info: - Type "help -tcl" to get an overview on Quartus II Tcl usages.
Info: *******************************************************************
one can get both the Quartus revision and the Tcl version:
tcl> puts $quartus(version)
Version 13.0.1 Build 232 06/12/2013 Service Pack 1 SJ Web Edition
tcl> info tclversion
8.5
A simple regular expression can be used to fetch a clean Quartus version number:
tcl> regexp {[\.0-9]+} $quartus(version) clean_number
1
tcl> puts $clean_number
13.0.1
The first command runs the regular expression on the full version string, and finds the first sequence consisting of digits and dots. The return value is “1″ because such a sequence was found. The third argument to regexp makes the interpreter put the matched string into the $clean_number variable, which is printed in the second command.
To list all elements in the $quartus array,
tcl> foreach key [array names quartus] { puts "${key}=$quartus($key)" }
version_base=13.0
ip_rootpath=/path/to/13.0sp1/ip/
copyright=Copyright (C) 1991-2013 Altera Corporation
load_report_is_needed=0
advanced_use=0
nativelink_tclpath=/path/to/13.0sp1/quartus/common/tcl/internal/nativelink/
quartus_rootpath=/path/to/13.0sp1/quartus/
processing=0
tclpath=/path/to/13.0sp1/quartus/common/tcl/
ipc_mode=0
nameofexecutable=quartus_sh
tcl_console_mode=2
natural_bus_naming=1
eda_tclpath=/path/to/13.0sp1/quartus/common/tcl/internal/eda_utils/
settings=
internal_use=0
regtest_mode=0
package_table={ddr_timing_model quartus_sta hidden} {rpwq qacv hidden} [...]
eda_libpath=/path/to/13.0sp1/quartus/eda/
args=
ipc_sh=0
version=Version 13.0.1 Build 232 06/12/2013 Service Pack 1 SJ Web Edition
binpath=/path/to/13.0sp1/quartus/linux/
project=
is_report_loaded=0
available_packages=::quartus::external_memif_toolkit ::quartus::iptclgen ::quartus::project ::quartus::device ::quartus::partial_reconfiguration ::quartus::report ::quartus::misc ::quartus::rapid_recompile ::quartus::incremental_compilation ::quartus::flow ::quartus::systemconsol
package_table was snipped, as it was very long. I’ve also mangled the path to Quartus’ files into /path/to, also in order to keep it short.
While working on Xillinux‘ port to Altera (the SocKit board, actually), I needed to connect two AXI masters: One for the VGA adapter, and one for the Xillybus IP core. Unlike Zynq, Altera’s HPS offers only one AXI slave port, so it’s up to Qsys to generate arbitration logic, implemented in the logic fabric, to connect these two masters to the HPS module.
But the interconnect’s details shouldn’t have bothered me, the user of Qsys. It was supposed to be a matter of connecting both masters to the same slave in Qsys’ graphical representation, and leaving the rest to the tools (Quartus 13.1 and 13.0sp1 in my case).
Only it went a little wrong. Besides, if you intend to use the WSTRB signals at all, you may want to avoid Altera’s master interconnect altogether. See below.
The generation failed as follows:
2013.12.14.17:22:33 Error: hps_0.f2h_axi_slave: width of ID signals (8) must be at least 9
2013.12.14.17:22:33 Info: merlin_domain_transform: After transform: 14 modules, 87 connections
2013.12.14.17:22:33 Info: merlin_router_transform: After transform: 28 modules, 129 connections
... snip ...
2013.12.14.17:22:34 Info: merlin_interrupt_mapper_transform: After transform: 62 modules, 201 connections
2013.12.14.17:22:38 Error: Generation stopped, 51 or more modules remaining
2013.12.14.17:22:38 Info: soc_system: Done soc_system" with 23 modules, 1 files, 298125 byte
Say what? The ID signals of masters on the AXI bus, which are connected to hps_0.f2h_axi_slave, should be 8 bits wide. Besides, where did the figure “9″ come from?
Also, note that Qsys is complaining about the width of a signal it generated itself (the port to the module that instantiates the HPS).
A word about ID widths
The IDs on the AXI bus are intended to identify the master that initiated the transaction, for several purposes (e.g. to allow loose reordering of packets from different masters). The full ID on the internal AXI bus is 12 bits wide.
Consequently, the ID widths presented by an FPGA slave on the AXI bus (attached to the regular or lightweight bridge, it doesn’t matter) should be 12 bits.
When the FPGA is master, the ID width is 8 bits. Rationale: The ID is 12 bits in the main interconnect, but bit 11 is always zero and bits [2:0] are 3′b100 for all packets from the FPGA bridge, so only 8 bits are left for setting by FPGA. See table 6-6 in the Cyclone V Device Handbook vol.3.
The solution
The answer is that the “9″ came from the width of the two master’s ID signals, which was 8, like they should be. It seems like the arbitration logic, which was automatically inserted by Qsys, added another bit in the ID field to distinguish between the two masters connected to it. So there are 9 bits. But the HPS can only offer 8 bits. Bummer.
Understanding the problem, the solution is simple: Reduce the masters’ ID signals’ width to, say, 4. Qsys then requires 5 bits from the HPS module, which is covered by its 8.
WSTRB lost by interconnect
After solving the problem described above, I combined two 64-bit masters into HPS’ slave, 64 bits as well, and experienced data corruptions. Some investigation revealed that the WSTRB signal wasn’t obeyed. Specifically, if WSTRB[7:0] was 0xf0 on a single-beat burst, all 64 bits ended up written into SDRAM, instead of leaving bits [31:0] intact. It’s not clear whether this happened occasionally or all the time, and if this is the only issue. I worked around this by connecting the write related AXI signals directly to the HPS (the arbitration was needed only for read signals), which solved the problem. Hence my conclusion that the interconnect was faulty.
The problem
There seems to be a minor DDR memory reliability issue with the SocKit, having the 5CSXFC6D6F31C8NES device marked “F AAAAU1319A”.
This can be detected by copying pseudorandom data from one buffer to another repeatedly, and then comparing the data between the buffers. The buffers must be large, to make sure the cache is flushed all the time. A single bit is flipped typically after a few Gigabytes of copied data or so.
A simple test program demonstrating this is at the bottom of this post. It should be compiled for Linux. The program accepts one single argument, which is the buffer size to use (in bytes).
This is what a typical session looks like:
# time ./memtest 16777216
Initialized lsr_state to 7ffeb059
On byte count 2985973160, position 0x7e3699, memcpy() length 16714658:

Destination:
7e3680 0d 1a 35 6b d6 ad 5a b5 6a d5 aa 55 aa 54 a9 52
7e3690 a4 48 91 22 45 8b 17 2e 5d bb 74 e8 d0 a1 42 85
7e36a0 0b 16 2c 59 b2 64 c8 90 21 43 87 0f 1e 3d 7b f6
7e36b0 ed da b4 68 d1 a2 44 88 10 20 40 80 01 03 07 0e
7e36c0 1d 3a 75 eb d7 af 5f bf 7e fd fb f6 ed db b6 6d
7e36d0 da b5 6a d4 a8 50 a1 43 87 0e 1c 38 70 e1 c3 86
7e36e0 0c 18 30 61 c2 85 0b 16 2d 5b b7 6e dc b9 72 e4
7e36f0 c9 93 27 4f 9f 3f 7f fe fd fa f5 eb d7 ae 5c b9
7e3700 72 e5 cb 96 2c 58 b1 63 c7 8e 1c 39 73 e6 cc 98

Source:
7e3680 0d 1a 35 6b d6 ad 5a b5 6a d5 aa 55 aa 54 a9 52
7e3690 a4 48 91 22 45 8b 17 2e 5d ba 74 e8 d0 a1 42 85
7e36a0 0b 16 2c 59 b2 64 c8 90 21 43 87 0f 1e 3d 7b f6
7e36b0 ed da b4 68 d1 a2 44 88 10 20 40 80 01 03 07 0e
7e36c0 1d 3a 75 eb d7 af 5f bf 7e fd fb f6 ed db b6 6d
7e36d0 da b5 6a d4 a8 50 a1 43 87 0e 1c 38 70 e1 c3 86
7e36e0 0c 18 30 61 c2 85 0b 16 2d 5b b7 6e dc b9 72 e4
7e36f0 c9 93 27 4f 9f 3f 7f fe fd fa f5 eb d7 ae 5c b9
7e3700 72 e5 cb 96 2c 58 b1 63 c7 8e 1c 39 73 e6 cc 98

real    1m0.834s
user    1m0.710s
sys    0m0.070
In this test run, an error was detected after about 60 seconds and almost 3 GB of data (2985973160 bytes, to be exact). Since we’re dealing with rare events, both the time and byte count may vary significantly until an error occurs. This can run for several minutes without anything happening too.
It may be significant to do this test after the system has been powered up from cold (i.e. been unpowered for a few minutes).
As seen above, the program dumps the hex data around the error, and points out the offset in the failed attempt, where the error was detected, 0x7e3699 in the case above. And indeed, the source buffer had the value 0xba, but in the destination buffer it was 0xbb. One single bit was flipped. It seems like it’s bits 0 and 1 that tend to turn out ’1′ instead of ’0′, but let’s skip the witchcraft.
It seems like the bit flipping occurs on writing to the memory, so the error is recorded in the DDR memory’s memory array, as opposed to a momentary error while reading. This speculation is backed by a test not shown in the program listed below, in which a second test is run when an error is detected. In this second test, the buffers are compared only by reading. The error was found consistently through several runs of this second test, indicating that the error is in fact written in memory, and not read wrong. Since the entire buffer was compared on each read-only comparison, finding the same error consistently cannot be attributed to caching.
The processor was configured as in the soc_system.qsys file included in soc_system_13_0_0_06252013_90253.tar.gz, which can be downloaded as a reference design for Linaro Desktop at Rocketboards. To be specific, the hps_0 settings for the memory interface and other hardware peripherals was bytewise identical (the bridges to FPGA had different settings, but that isn’t relevant to this issue).
A few words about terminations
It’s possible to eliminate these bit errors by modifying the ODT settings of the DDR memory. But let’s first explain what it’s all about.
As the signals going between the Cyclone chip and the DDR memory switch extremely fast, the short copper wires that connect these two devices are passing through electromagnetic waves, rather than steady voltages. These wires are analyzed in the same terms as antennas and waveguides, with the goal of reducing back-and-forth reflections, and damping them as fast as possible.
One of the means for reducing reflections is to place resistors, called terminations, at the ends of these wires. In order to achieve a good result and avoid a dense placement of a lot of components on the board, these resistors are often included on the chip’s silicon. In other words, it’s an On Die Termination (ODT). Whether they should be applied, and what resistance they have is programmable, both on the FPGA’s side and on the DDR memory. The choice is usually made in conjunction with running electromagnetic simulations on the PCB’s physical layout, and picking values that produce good waveforms. If this crucial part in the PCB design process is done improperly, memory corruption occurs, sometimes to the level of rendering the system useless, and sometimes causing rare bit flipping, as experienced with the SocKit.
There are four major parameters influencing the signal integrity:
- The termination on the Cyclone V device: Whether applied, and its resistance
- The Nominal ODT of the DDR memory: Whether applied, and its resistance. The term “nominal” is just a fancy word to distinguish from the one listed next;
- The Dynamic ODT of the DDR memory: Whether applied, and its resistance. This optional feature allows programming a different resistance which is applied only when the data lines are used for a write operation (i.e. the lines are driven by the FPGA). When this feature is disabled (“off”) the Nominal ODT’s setting holds all the time.
- The Output Drive Strength or Output Impedance of the DDR memory: This controls the current applied when the DDR memory drives the wires either high or low. The magnitude is given in terms of an equivalent resistor, connected either to the power supply or to ground.
Except for the item above, all parameters are set in Qsys by editing the HPS block, on the SDRAM tab, going to the “Memory Parameters” sub-tab.
When the reference design is followed, the Cyclone device is programmed to apply a 50 Ohm termination on all data wires. This is a result of the reference resistor on the board, R295 connected to D27, which is 100 Ohms.
The DDR is programmed to a nominal termination of RZQ/4 = 60 Ohms. The dynamic termination is enabled and set to RZQ/4 = 60 Ohms as well. The output drive strength is RZQ/7 = 34 Ohms. These figures are derived from the reference resistors to the memories, R288 and R269, both 240 Ohms.
There’s something peculiar about setting the dynamic ODT to the same value as the nominal, as turning the dynamic termination off altogether should have the same effect, in theory. As seen below, reality has it’s own say about this.
Tweaking termination settings
By all means, the correct way to set up the parameters related to signal integrity is applying the correct values that were chosen when the PCB was designed, based upon proper simulations. Since the performance of the reference design’s settings aren’t satisfactory, there’s no choice but tweaking the parameters until the bit errors vanish, hoping that the new setting will work well on other boards and throughout a reasonable temperature range. This is not a desired solution, but a last resort.
Several settings were tried out. I have to admit that I was surprised how little effect these settings had: The system had no problem booting in any of the experiments I made, and the difference was only sensed while running heavy tests.
The following three settings appeared to result in no errors (each one described with the one change relative to the reference design):
- Output drive strength set to RZQ/6 = 40 Ohms
- ODT completely turned off (Nominal and dynamic alike)
- Disabling dynamic ODT off only.
Things that didn’t reduce errors: Setting the dynamic ODT to RZQ/2, setting the nominal ODT to RZQ/2 or RZQ/6, or disabling the nominal ODT while leaving the dynamic ODT as before.
The only change that could make sense is reducing the output drive strength: Recall that the errors were most likely generated on writes to the memory. One possible reason for bit flipping is that reflections keep running on the wires from a previous read operation when the lines are turned over for writing, so that the voltage levels of bits intended for writing is disrupted by this noise. Reducing the memory’s driving current obviously reduces the this noise as well.
Turning off the ODT should increase the reflections, so it’s not clear why this helped. And disabling the dynamic ODT should make any difference at all, since the nominal resistance is the same anyhow. Nevertheless, it was verified that this change made a difference.
When dealing with signal integrity without the proper simulation tools, it’s not rare that one can’t explain why one action helped and another didn’t.
As for my own attempt to solve the problem, I initially chose reducing the drive strength to RZQ/6. At least, this change doesn’t contradict common sense. But extensive tests exposed a bit error for each ~1 TB of data handled (this is very crude error rate estimation). Turning off ODT completely ran through the same longer test with no errors detected at all, so this was the setting I chose. This might be specific to my own board, though.
The program
So here it is, if you want to try it out yourself. It’s a hack of pieces of code I had around, so it’s not really top-notch software engineering… (and WordPress killed the indentation)
#include <stdio.h>
#include <unistd.h>
#include <stdlib.h>
#include <sys/types.h>
#include <sys/stat.h>
#include <fcntl.h>
#include <time.h>
#include <signal.h>
#include <errno.h>
#include <string.h>

static unsigned int lsr_state;
static long long count = 0;
static char rand_state[32];

void randseed() {
 int fd;
 fd = open("/dev/urandom", O_RDONLY);

 if (fd < 0) {
 perror("open");
 exit(1);
 }

 if (!initstate(0, rand_state, sizeof(rand_state))) {
 fprintf(stderr, "Call to initstate() failed.\n");
 exit(1);
 }

 if (read(fd, rand_state, sizeof(rand_state) ) != sizeof(rand_state)) {
 fprintf(stderr, "Failed to read from /dev/urandom\n");
 exit(1);
 }

 close(fd);

 if (!setstate(rand_state)) {
 fprintf(stderr, "Call to setstate() failed.\n");
 exit(1);
 }
}

void hexprint (unsigned char *buf, int at, unsigned long int n) {
 int i, j, from, to;

 from = (at & 0xfffffff0) - 16;
 if (from < 0)
 from = 0;

 to = (at & 0xfffffff0) + 127;
 if (to >= n)
 to = n-1;

 for (i=from; i<to; i+=16) {
 printf("%04x", i);

 for (j=i; ((j<(i+16)) && (j<=to)); j++)
 printf(" %02x", buf[j]);

 printf("\n");
 }
}

void exit_program(int sig) {
 fprintf(stderr, "memtest: Checked %lld bytes\n", count);

 exit(0);
}

int main(int argc, char *argv[]) {

 int bufsize, startpos1, startpos2, bytecount, i, bit;
 unsigned char *buf, *destbuf, *p, *b1, *b2;

 if (argc != 2) {
 fprintf(stderr, "Usage: %s buffer-size\n", argv[0]);
 exit(1);
 }

 (void) signal(SIGINT, exit_program);
 (void) signal(SIGQUIT, exit_program);
 (void) signal(SIGTERM, exit_program);
 (void) signal(SIGALRM, exit_program);

 bufsize = atoi(argv[1]);

 if (bufsize < 65536) {
 fprintf(stderr, "Bufsize %d too small (at least 65536)\n", bufsize);
 exit(1);
 }

 if (!(buf = malloc(bufsize))) {
 fprintf(stderr, "Failed to allocate %d bytes for buffer\n", bufsize);
 exit(1);
 }

 if (!(destbuf = malloc(bufsize))) {
 fprintf(stderr, "Failed to allocate %d bytes for buffer\n", bufsize);
 exit(1);
 }

 randseed();

 do {
 lsr_state = random();
 fprintf(stderr, "Initialized lsr_state to %08x\n", lsr_state);
 } while (lsr_state == 0);

 for (i=0; i<bufsize; i++) {
 p = (unsigned char *) &lsr_state;

 buf[i] = *p++;

 bit = ((lsr_state >> 19) ^ (lsr_state >> 2)) & 0x01;

 lsr_state = (lsr_state << 1) | bit;

 if (lsr_state == 0) {
 fprintf(stderr, "Huh? The LSR state is zero!\n");
 exit(1);
 }
 }

 while (1) {
 startpos1 = random() & 0x7fff;
 startpos2 = random() & 0x7fff;
 bytecount = bufsize - 32768 - (random() & 0x7fff);

 b1 = destbuf + startpos1;
 b2 = buf + startpos2;

 memcpy(b1, b2, bytecount);

 for (i=0; i<bytecount; i++, count++)
 if (*b1++ != *b2++) {
 printf("On byte count %lld, position 0x%x, memcpy() length %d:\n",
 count, i, bytecount);

 printf("\nDestination:\n");
 hexprint(destbuf + startpos1, i, bufsize);
 printf("\nSource:\n");
 hexprint(buf + startpos2, i, bufsize);

 exit(1);
 }
 }
 return 0;
}
Wildcards
There is a certain confusion regarding how wildcards are matched in the SDC file (in fact, by the Tcl commands), which is why full paths are often used. This causes overloaded SDC files that don’t survive changes in the hierarchy.
For example, regarding get_pins, the SDC and TimeQuest API Reference Manual page 2-15 states that pipe characters (“|”) are treated as special characters, and are therefore not matched against the “*” wildcard in the default mode. So by default, the full path has to be given, except for specific strings within hierarchies.
The -hierarchical flag somewhat helps by allowing relative names (skip the beginning of the path).
For a classic Tcl match, where ‘*’ can match a pipe character, use -compatibility_mode.
But what about get_clocks?
Experimenting
One significant advantage of Tcl scripting over Xilinx’ UCF is that one can try out the expressions in a Tcl shell. Some basics can be found in page 3-17 of the Quartus II Handbook, vol.1, chapter 3.
More inspiration can be taken from the examples in the SDC and TimeQuest API Reference Manual. It may also be helpful to look at the Quartus II Scripting Reference Manual.
From the command line, using the “-s” flag:
$ quartus_sta -s
After the welcome note, open the project (after fitting) and create a timing netlist:
tcl> project_open myproject
tcl> create_timing_netlist
tcl> read_sdc
tcl> update_timing_netlist
for effectively opening myproject.qsf. The two latter are required for get_clocks to work. One can go e.g.
tcl> get_clocks -long_help
to get some help (same text as in the manuals).
It’s possible to test what matches which command. For example, to list the PLL-derived clocks (based upon the signal’s name):
tcl> set mypins [ get_pins -compatibility_mode *|divclk ]
tcl> foreach_in_collection pin $mypins { puts [get_pin_info -name $pin] }
The Tcl shell will print something like “_col0″ in the middle to indicate that a collection has been set up. This collection is accessed through $mypins. The second command prints the matched pins to the console.
Or for those who prefer one-liners (all pins on top-level):
tcl> query_collection -all [ get_pins * ]
The “-all” flag overrides the default limit of 20 elements. To have each printed on a separate line,
tcl> foreach i [ query_collection -all [ get_pins -hierarchical * ] ] { puts "Pin: $i" }
The -hierarchical flag is important. Without it, only the toplevel pins are given (even for just [ get_pins ]). Counterintuitive, but nevertheless true. The -compatibility_mode flag is also fine (used a lot in this post) but is Quartus specific.
The counterpart for “-all” is “-limit 1″, which fetches only the first element.
So what about get_clocks?
Listing all clocks in the design on separate lines:
tcl> foreach i [ query_collection -all [ get_clocks ] ] { puts "$i" }
Or use foreach_in_collection:
tcl > foreach_in_collection i [ get_clocks ] { puts [ get_clock_info $i -name ] }
Note that get_clock_info can obtain information other than just the name.
Alternatively, use “join” instead of “foreach”:
tcl> join [ query_collection -all [ get_clocks ] ] "\n"
If nothing is printed, and instead it says
Warning (332173): Ignored filter: * could not be matched with a clock
it’s most likely because read_sdc and update_timing_netlist haven’t been issued, as mentioned above.
tcl> foreach i [ query_collection -all [ get_clocks *|vga_pll|*|divclk] ] { puts $i }
which, surprisingly enough worked in the convenient way: The wildcards matched pipe characters, so one can, in fact, use this simple format in SDC files, e.g.
set_false_path -from [get_clocks *|vga_pll|*|divclk] -to [get_clocks *|bus_pll|*|divclk]
set_false_path -from [get_clocks *|bus_pll|*|divclk] -to [get_clocks *|vga_pll|*|divclk]
for setting up false paths between two clocks that are derived from a common reference with PLLs, the wrong way.
The correct way is with set_clock_groups, but that’s not what this post is about… And by the way, Quartus doesn’t have a shortcut to include derived clocks in set_clock_groups, like in Vivado. So the PLLs’ output clocks must be named explicitly (but wildcards help).
Getting all kind of info
If we’re at it, all kind of info can be obtained on cells in the design. For example, the location of certain instances in the design (pins etc. can also be obtained with different parameters to get_cell_info):
foreach_in_collection cell [ get_cells -compatibility_mode *rx_pma.rx_cdr] { puts "[get_cell_info $cell -location ]: [get_cell_info $cell -name]" }
QSF scripting
Pointing at specific cells by virtue of expressions works within a script, but not in the QSF file. For example, this works as a script
set_instance_assignment -name CDR_BANDWIDTH_PRESET High -to [ get_cells -compatibility_mode *|xcvr_inst|*rx_pma.rx_cdr]
but fails in a QSF file.
It’s possible to retrieve the already existing assignments. Try
tcl> get_instance_assignment -help
tcl> get_all_assignments -long_help
The latter gives some interesting examples on scanning existing assignments. In particular, turning one of the examples into a (very long) one-liner, once can go
tcl> foreach_in_collection asgn_id [get_all_assignments -type instance -name *] { set from [get_assignment_info $asgn_id -from] ; set to [get_assignment_info $asgn_id -to] ; set name [get_assignment_info $asgn_id -name] ; set value [get_assignment_info $asgn_id -value] ; puts "$name ($from -> $to) = $value" }
in order to list all instance assignments (i.e. echo the QSF’s assignments).
Same for all global assignments (and there are many):
foreach_in_collection asgn_id [get_all_assignments -type global -name *] { set entity [get_assignment_info $asgn_id -entity] ; set name [get_assignment_info $asgn_id -name] ; set value [get_assignment_info $asgn_id -value] ; puts "$entity: $name = $value" }
Not clear what it’s useful for, but anyhow