peakdet: Peak detection using MATLAB (non-derivative local extremum, maximum, minimum)
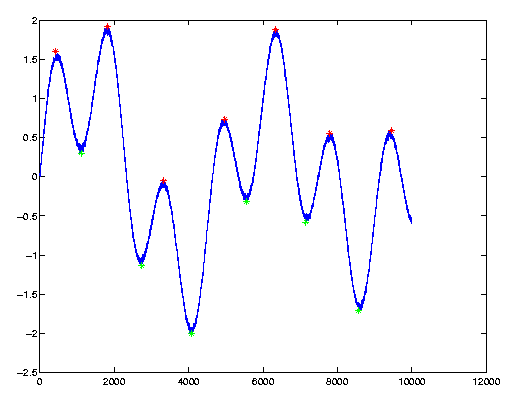
Here’s a problem I encounter in several fields: Find the local maxima and minima in some noisy signal, which typically looks like the following graph:

The local maxima and minima are plotted as red and green stars on the graph. To the eye it’s so obvious where they are, but making a computer find them can turn out tricky.
Let’s start with what not to do: Using the well-known zero-derivate method. Due to the noise, which is always there in real-life signals, accidental zero-crossings of the first derivate occur, yielding false detections. The typical solution is to smooth the curve with some low-pass filter, usually killing the original signal at the same time. The result is usually that the algorithm goes horribly wrong where it’s so obvious to the eye.
In many cases, we don’t really care about maxima and minima in the mathematical sense. We can see the peaks and valleys, and we want the computer to find them. This is what “peakdet” does.
The trick here is to realize, that a peak is the highest point betweem “valleys”. What makes a peak is the fact that there are lower points around it. This strategy is adopted by “peakdet”: Look for the highest point, around which there are points lower by X on both sides.
Let’s see an example: First, let’s create the graph shown in the figure above:
>> t=0:0.001:10;
>> x=0.3*sin(t) + sin(1.3*t) + 0.9*sin(4.2*t) + 0.02*randn(1, 10001);
>> figure; plot(x);
Now we’ll find the peaks and valleys: (you’ll need to copy the “peakdet” function from the bottom of this page and put it in your working directory or a directory in the MATLAB search path):
>> [maxtab, mintab] = peakdet(x, 0.5);
>> hold on; plot(mintab(:,1), mintab(:,2), 'g*');
>> plot(maxtab(:,1), maxtab(:,2), 'r*');
Note the call to peakdet(): The first argument is the vector to examine, and the second is the peak threshold: We require a difference of at least 0.5 between a peak and its surrounding in order to declare it as a peak. Same goes with valleys.
The returned vectors “maxtab” and “mintab” contain the peak and valley points, as evident by their plots (note the colors).
The vector’s X-axis values can be passed as a third argument (thanks to Sven Billiet for his contribution on this), in which case peakdet() returns these values instead of indices, as shown in the following example:
>> figure; plot(t,x);
>> [maxtab, mintab] = peakdet(x, 0.5, t);
And from here we continue like before, but note that the X axis represents “t” and not indices.
>> hold on; plot(mintab(:,1), mintab(:,2), 'g*');
>> plot(maxtab(:,1), maxtab(:,2), 'r*');
As for the implementation of this function: The work is done with a for-loop, which is considered lousy practice in MATLAB. Since I’ve never needed this function for anything else than pretty short vectors (< 100000 points), I also never bothered to try speeding it up. Compiling to MEX is a direct solution. I’m not sure if it’s possible to vectorize this algorithm in MATLAB. I’ll be glad to hear suggestions.
A final note: If you happen to prefer Python, you could try this (someone has been kind enough to convert this function). There are also a version in C by Hong Xu and a version in FORTRAN 90 by Brian McNoldy. I haven’t verified any of these.
And here is the function. Copy and save it as ‘peakdet.m’. It’s released to the public domain:
function [maxtab, mintab]=peakdet(v, delta, x)
%PEAKDET Detect peaks in a vector
%        [MAXTAB, MINTAB] = PEAKDET(V, DELTA) finds the local
%        maxima and minima ("peaks") in the vector V.
%        MAXTAB and MINTAB consists of two columns. Column 1
%        contains indices in V, and column 2 the found values.
%
%        With [MAXTAB, MINTAB] = PEAKDET(V, DELTA, X) the indices
%        in MAXTAB and MINTAB are replaced with the corresponding
%        X-values.
%
%        A point is considered a maximum peak if it has the maximal
%        value, and was preceded (to the left) by a value lower by
%        DELTA.

% Eli Billauer, 3.4.05
% This function is released to the public domain; Any use is allowed.

maxtab = [];
mintab = [];

v = v(:); % Just in case this wasn't a proper vector

if nargin < 3
  x = (1:length(v))';
else
  x = x(:);
  if length(v)~= length(x)
    error('Input vectors v and x must have same length');
  end
end

if (length(delta(:)))>1
  error('Input argument DELTA must be a scalar');
end

if delta <= 0
  error('Input argument DELTA must be positive');
end

mn = Inf; mx = -Inf;
mnpos = NaN; mxpos = NaN;

lookformax = 1;

for i=1:length(v)
  this = v(i);
  if this > mx, mx = this; mxpos = x(i); end
  if this < mn, mn = this; mnpos = x(i); end

  if lookformax
    if this < mx-delta
      maxtab = [maxtab ; mxpos mx];
      mn = this; mnpos = x(i);
      lookformax = 0;
    end
  else
    if this > mn+delta
      mintab = [mintab ; mnpos mn];
      mx = this; mxpos = x(i);
      lookformax = 1;
    end
  end
end
Reader Comments
Hi there, I ported your code to LabVIEW!